 |
|
|
| Water quality | |||||||||||||||||||||||||||||||||||||||||||||||||||||||||||||||||||||||||||||||||||||||||||||||||||||||||||||||||||||||||||||||||||||||||||||||||||||||||||||||||||||||||||||||||||||||||||||||||||||||||
| See Deephams Sewage Works. | See Polluted Lea. | ||||||||||||||||||||||||||||||||||||||||||||||||||||||||||||||||||||||||||||||||||||||||||||||||||||||||||||||||||||||||||||||||||||||||||||||||||||||||||||||||||||||||||||||||||||||||||||||||||||||||
| This report was written for Thames21 by consultant Grieg R Davies. He produced it on December 13, 2011, and it was based on water sampling between November 22 and December 4, 2011. His conclusions are bleak. The Lea has severe problems. There were alarmingly high levels of total coliforms, indications that the Lea may be infested with disease causing pathogens. In brief the waterway is heavily polluted. To download the original report "A water quality analysis of the River Lea and major tributaries within the perimeter of the M25, from Waltham Abbey to Bow Locks -Thames21" hit this link. | |||||||||||||||||||||||||||||||||||||||||||||||||||||||||||||||||||||||||||||||||||||||||||||||||||||||||||||||||||||||||||||||||||||||||||||||||||||||||||||||||||||||||||||||||||||||||||||||||||||||||
| A water quality analysis of the River Lea and major tributaries within the perimeter of the M25, from Waltham Abbey to Bow Locks -Thames21
The River Lee (or Lea) is a large lowland river originating from a spring near Well Head inside Waulud's Bank at Marsh Farm, Bedforshire (TL061244). It has a length of 68 km flowing through Hertfordshire and north east London to the River Thames, London near Blackwall (TQ395806). There are about two million people living reasonably close to its banks (the riparian areas). Some parts have been canalised and used for transport (the Lee Navigation) and there are locks and parallel sections (the flood relief channel, for example). Some tributaries have been extensively culverted (covered over), for example the Moselle Brook. The Deephams Sewage Treatment Works is the sole treatment plant located within London area of the River Lee that discharges treated effluent into the Lee from Pymmes Brook via Salmons Brook. In heavy rain wash litter, leaves, animal faeces, mineral oils and road grit into urban rivers. This report offers a snapshot of water quality between November 22 and 29, 2011. 4.1 Nitrate and reactive phosphate Excessive amounts of nitrogen and phosphorus can cause eutrophication. This is the general deterioration of a waterbody due to increased microbial respiration resulting in reduced dissolved oxygen levels in the water, therefore depriving other organisms of oxygen. Increased levels of these nutrients have also been known to cause toxic algal blooms. Phosphorus is not toxic to humans or animals, but excessive concentrations of nitrate (>10 mg/L) can cause methemoglobinemia or blue baby syndrome. Sources of these can include fertiliser and agricultural run-off, failing septic systems, faulty or inadequate waste water treatment plant discharges, wastes from domestic and livestock animals in addition to commercial wastes. 4.2 Dissolved Oxygen The saturation (%) or concentration (mg/L) of dissolved oxygen within water is vital for fish and aquatic invertebrates. It is very much dependant on the temperature of water, decreasing as water warms. Aquatic aerobic micro-organisms can consume a considerable proportion of dissolved oxygen. Dissolved oxygen can also be replaced by photosynthesising organisms, such as water plants. 4.3.Biochemical Oxygen Demand Organic detritus in the water is a food source for bacteria and other micro-organisms, reducing the dissolved oxygen present for other aquatic organisms. The main function of sewage and wastewater treatment plants is to reduce levels of Biochemical oxygen demand (BOD) in the effluent that is discharged into natural waters. 4.4 Chemical Oxygen Demand Chemical oxygen demand (COD) is a measure of the total quantity of oxygen required to oxidise all organic material into carbon dioxide and water. 4.5. pH pH is a measure of the amount of free hydrogen ions in water.In layman's terms it is referred to as the measure of either acidity (pH 0-6) or alkalinity (8- 14) within a sample of water, with pH 7 referred to as the pH of 'pure' water. This that live in water can be highly sensitive to a change in pH. Low pH (acidic conditions) can make it more difficult to move pollutents (including heavy metals) from rivers. 4.6. Turbidity Turbidity is an indicator of the quantity of matter suspended in a water sample. This can be organic (e.g. microbes, plankton, plant and animal detritus) and inorganic (e.g. silts, clays and sands). It is determined by the amount of light that is scattered or absorbed by a sample, or the level of transparency. Turbidity can be an indicator of water quality problems such as erosion, contaminant particles (e.g. heavy metals), excessive growth of micro-organisms (e.g. algal blooms) and the reduction of light wavelengths required for photosynthesis. Generally, most people consider very turbid water 'unclean', aesthetically displeasing and unsuitable for consumption. 4.7. Faecal and total coliforms Faecal coliforms are found within the digestive systems of warm-blooded animals and are passed into the environment through animal faecal waste. Faecal coliform bacteria do not cause disease themselves, but they are used as an indicator for the presence of other disease causing pathogens. They can come from faulty septic tanks, faulty sewage treatment plants, untreated or incompletely treated sewage effluent, agricultural wastes and domestic pets. Tests usually home in on Escherichia coli colonies in samples, the other bacteria can also be counted. 4.8. Water temperature Flowing water temperatures are likely to be more variable than deep, still water (lakes). Aquatic organisms from temperate regions such as Europe and in particular the UK are sensitive to rapid changes in temperature, and normally require water temperatures below 20°C with 8-10°C usually being an optimum for most species. The level of dissolved oxygen within water is also temperature dependant, and therefore it is important to know the long-term variances of temperature. 4.9. Conductivity and total dissolved solids The conductivity of water is a more-or-less linear function of the concentration of dissolved ions. Conductivity itself is not a human or aquatic health concern, but because it is easily measured, it can serve as an indicator of other water quality problems. If the conductivity of a stream suddenly increases, it indicates that there is a source of dissolved ions nearby. Water treatment plants use flocculants to aggregate suspended and dissolved solids into particles large enough to settle out of the water column in settling tanks. Results 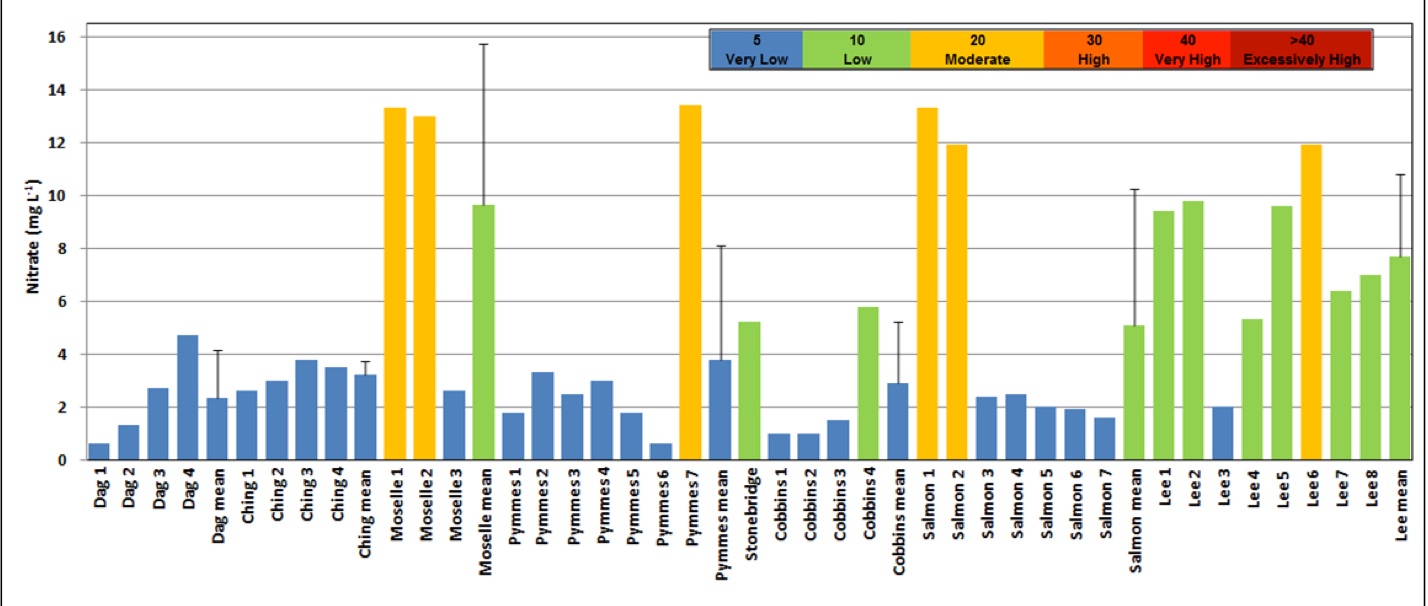 Figure 11.1 - Concentrations of nitrate (mg/L) determined at each sample site within the investigation. The mean value of nitrate concentration for each watercourse is calculated from the concentration values of all samples sites along its length. Whiskers on the mean concentration bars indicate the standard deviation. The classification scale is taken from the European Union Water Framework Directive (2000/60/EC). 11.2. Reactive phosphate The concentration of reactive phosphate within water samples were between 'high' (0.2-1.0 mg/L) and 'excessively high' (>1 mg/L) according to the European Union Water Framework Directive (2000/60/EC) classification scale. All sites on the River Lee were 'excessively high' for reactive phosphate between 5.07 mg/L and 15.75 mg/L. Only the first sample site on the Pymmes Brook (Baring Road/Fordham Road) and the second site on Cobbins Brook (Upshire at Cobbinsend Road) were observed to be 'high' in phosphate concentration (0.2-1.0 mg/L), with Upshire at Cobbinsend Road possessing the least reactive phosphate concentration in the dataset at 0.56 mg/L. All other samples were found to possess significantly higher concentrations of phosphate (>1.0 mg/L). The Ching had the least mean value of reactive phosphate concentration at 3.17 ± 0.56 mg/L. The greatest concentration found within a single sample was 15.75 mg/L which was observed at the site downstream of the confluence between the Hertford Union Canal and the River Lee Navigation. (NOTE: The Hertford Union Canal or Duckett's Canal is a short stretch (c. 1.5 km) of canal in east London. It connects the Regent's Canal to the Lee Navigation. This spot was next to the Olympics site!) 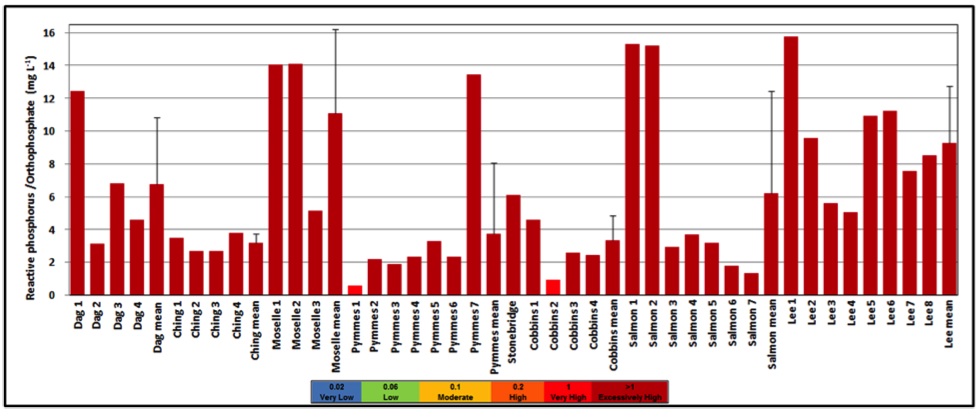
Figure 11.2 - Concentrations of reactive phosphate (mg/L) determined at each sample site within the investigation. The mean value of reactive phosphate concentration for each watercourse is calculated from the concentration values of all samples sites along its length. Whiskers on the mean concentration bars indicate the standard deviation. The classification scale is taken from the European Union Water Framework Directive (2000/60/EC). 11.3. Dissolved oxygen Samples on the River Lee ranged between 50 % (fair) and 69 % (fairly good).The single site with 'poor' dissolved oxygen was site 3 on the Moselle Brook at Tottenham Cemetery with 14 %. The majority of other sites within the investigation possessed between 21 % (bad) and 68 % (fairly good) dissolved oxygen, with seventeen of the thirty-nine sites (44 % of sites) possessing 'bad' levels percentage dissolved oxygen (21- 50 %).The waterway with the least mean % dissolved oxygen was the Moselle Brook with 31 ± 17 % dissolved oxygen. (NOTE: The River Moselle, or Moselle Brook, flows through Tottenham towards the Lea. The river was originally a tributary of the River Lea, but it now flows into Pymmes Brook. Long stretches have been culverted (Moselle Avenue in Noel Park runs above the culverted river), But much of its route can be traced easily. For example, it can be seen flowing overground in Tottenham Cemetery.) There was a highly significant statistical difference in the percentage saturation of dissolved oxygen between the different watercourses in the investigation (P<0.01). Further tests revealed significant statistical differences in % saturation of dissolved oxygen between the River Lee and Dagenham Brook/ Pymmes Brook/ Moselle Brook/ and Salmons Brook. 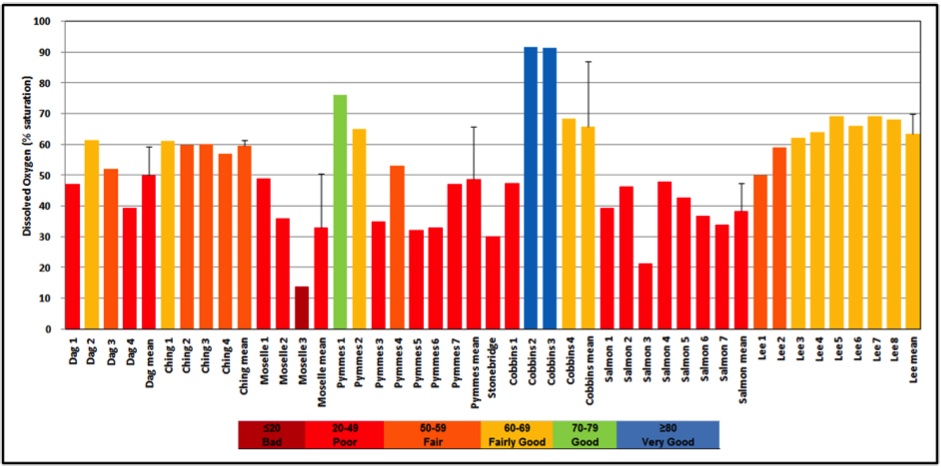
Figure 11.3 - Values for dissolved oxygen saturation (%) determined at each sample site within the investigation. The mean value of dissolved oxygen saturation for each watercourse is calculated from the concentration values of all samples sites along its length. Whiskers on the mean concentration bars indicate the standard deviation. The classification scale is taken from the Environment Agency General Quality Assessment (GQA) scheme. 11.4. Biochemical oxygen demand (BOD) Values of BOD (mg/L) within samples ranged between 'very good' and 'fair' according to the Environment Agency General Quality Assessment (GQA) scheme. Further testing revealed that there were statistically significant differences between the River Lee and all other watercourses for values of BOD, with the exception of the Pymmes Brook and Salmons Brook. 
Figure 11.4 - Values of biochemical oxygen demand (BOD) (mg/L) determined at each sample site within the investigation. The mean value of BOD for each watercourse is calculated from the concentration values of all samples sites along its length. Whiskers on the mean concentration bars indicate the standard deviation. The classification scale is taken from the Environment Agency General Quality Assessment (GQA) scheme. 11.5. Chemical oxygen demand (COD) Values of COD (mg/L) within all samples fell within the 'poor' category according to the classification taken from the European Union Water Framework Directive (2000/60/EC) (Figure 11.5). 
Figure 11.5 - Values of chemical oxygen demand (COD) (mg/L) determined at each sample site within the investigation. The mean value of COD for each watercourse is calculated from the concentration values of all samples sites along its length. Whiskers on the mean concentration bars indicate the standard deviation. The classification scale is taken from the Protection of Surface Waters Intended for the Abstraction of Drinking Water, now Water Framework Directive (2000/60/EC). 11..6. pH All of the pH values for water samples were within the 'good' category according to the European Union Council Directive Freshwater Fish Directive (Figure 11.6). Sites on the River Lee possessed pH values between pH 7.76 and 7.88. 
Figure 11.6 - Values of pH which were determined for each sample site within the investigation. The mean value of pH for each watercourse is calculated from the concentration values of all samples sites along its length. Whiskers on the mean concentration bars indicate the standard deviation. The classification scale is taken from the Freshwater Fish Directive, 78/659/EEC. 11.7. Turbidity Sampled sites varied from 17 FAU (intermediate) to 258 FAU (very turbid). Only six sites (16 %) within the investigation possessed 'clear' values for turbidity. 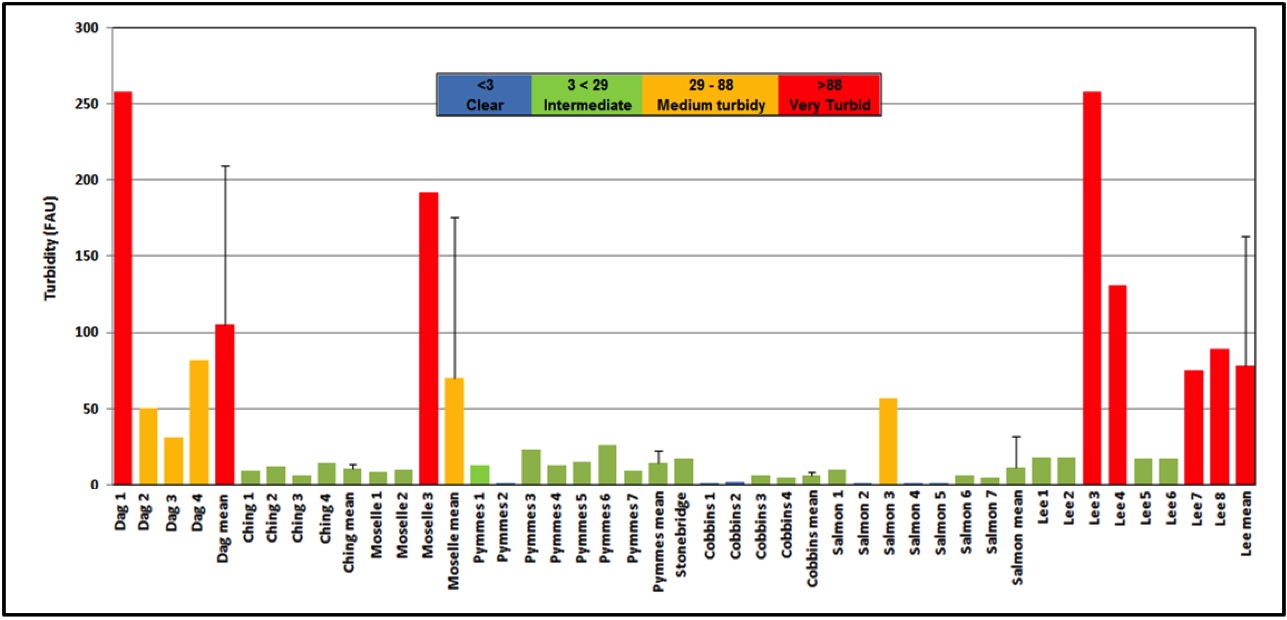
Figure 11.7 - The mean value of turbidity (FAU) for each watercourse is calculated from the concentration values of all samples sites along its length. Whiskers on the mean concentration bars indicate the standard deviation. The classification scale is taken from the European Union Water Framework Directive (2000/60/EC). 11.8. Faecal coliforms Faecal coliforms were completely absent from seven of the sites (18 %) in this investigation. There were twelve sites (32 %) found to be between the 'guideline' and 'imperative' levels (<2000 CTU per 100 ml), and the remainder of sites (50%) were over the set 'imperative' level (>2000 CTU per 100 ml) according to the European Community Bathing Water Directive 76/160/EEC (Figure 11.8). Faecal coliforms were only absent on one site of the River Lee (site 3 Bow Backs River). 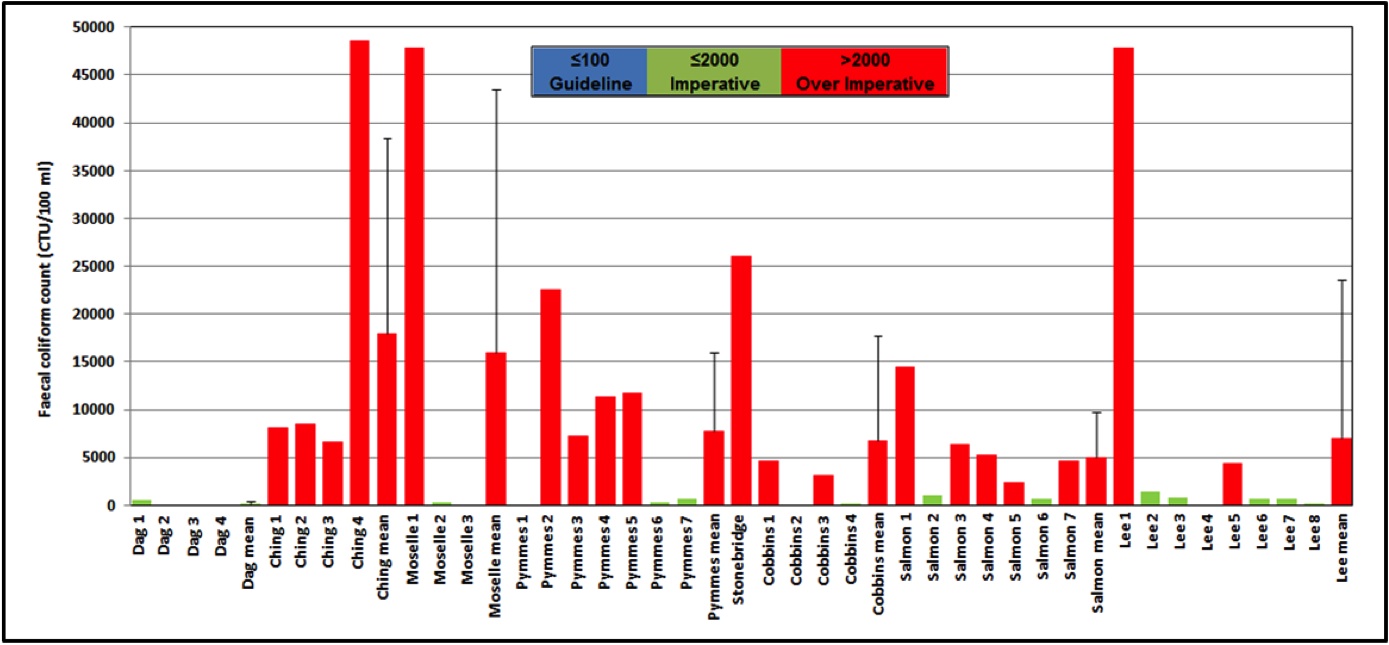
Figure 11.8 - The mean value (in CTU/100 ml) of faecal coliforms for each watercourse is calculated from the concentration values of all samples sites along its length. Whiskers on the mean concentration bars indicate the standard deviation. The classification scale is taken from the European Community Bathing Water Directive 76/160/EEC, and its proposed revision. 11.9. Total coliforms £ All samples were over the 'imperative' threshold for total coliforms (>10000 CTU) specified by the European Community Bathing Water Directive 76/160/EEC (Figure 11.9). Sites on the River Lee were between 21900 and 241100 CTU. 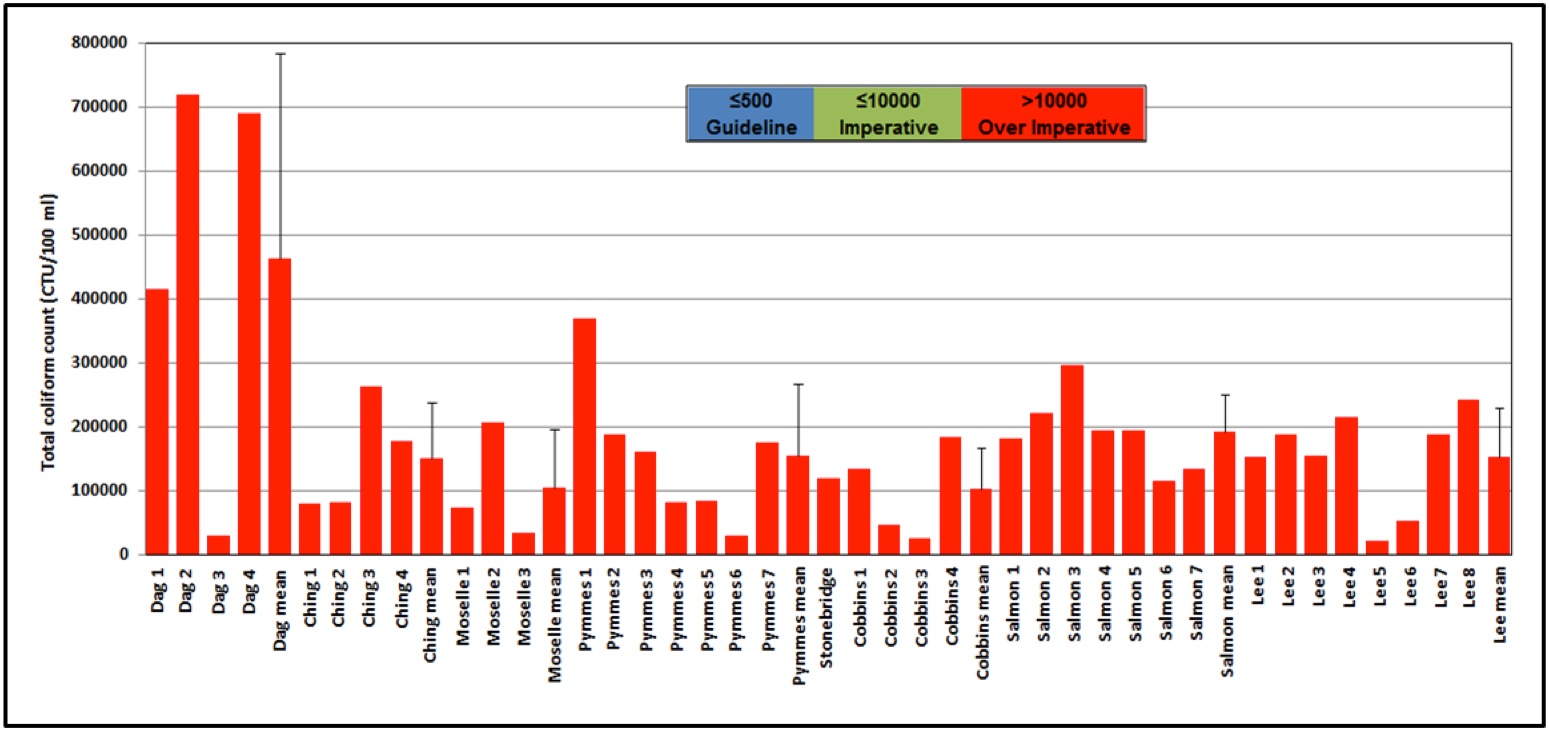
Figure 11.9 - The mean value of total coliforms (CTU/100 ml) for each watercourse is calculated from the concentration values of all samples sites along its length. Whiskers on the mean concentration bars indicate the standard deviation. The classification scale is taken from the European Community Bathing Water Directive 76/160/EEC, and its proposed revision. 11.10. Watercourses ranked by water quality index scores A simple water quality index was used to assess the 'health' of each waterway and therefore give a comparison, the score weighting for each parameter is given in Table 11.1. 
Table 11.1 - A table illustrating the classification points scale that was assigned to each water quality parameter. 
Table 11.2 compares the seven watercourses within this investigation ranked in order of the number of total points that they have been scored. The Ching was assessed to be the 'healthiest' waterway with 23 points or a score of 59 %. The average score between the watercourses within this investigation was 20 points or 51 %. The Moselle Brook, Pymmes Brook and River Lee were assessed to have average water quality or half of the optimum 'health' score, as they all individually scored 20 points or 51 %. Only the Dagenham Brook and Cobbins Brook had above average water quality at 21 and 22 points, or 54 and 56 % respectively. Salmons Brook was assessed to have below average water quality with 19 points or 49 %, while the waterway with the worst 'health' was Stonebridge Brook with 18 points or 46 %. 11.11. Sample sites ranked by water quality index scores Using the same scoring criteria outlined in Table 11.1 within Section 11.10 above, it was possible to assess individual sampling sites on their 'health' or water quality. Within Table 11.3 is the list of sample sites within this investigation together with their assigned water quality score from the index. The site with the highest water quality score was Cobbinsend Road (site 2) on Cobbins Brook with 28 points or 72 %. The average score for sites in this investigation was 22 points or 54 %, with the majority of sites (82 %) possessing a water quality score of greater than 20 points or 50 %. Of all thirty-eight sites only three were found to possess scores of 51 %, or half of the optimum scores for water quality. These included Stonebridge Loch (site 1) on the Moselle Brook, West Walk (site 3) on the Pymmes Brook, and south of the confluence with Deephams STW (site 2) on the Salmons Brook. Four sites within the investigation were found to be lower than 20 points or less than 51 % for water quality. The site with the worst water quality score was Deephams STW outfall (site 1) on the Salmons Brook with 17 points or 44 %. Sites that also possessed below average water quality scores included Montague Road (site 3) on the Salmons Brook, the confluence of the Pymmes Brook with the River Lee (site 7) and the single site on Stonebridge Brook. 
Table 11.3 - A list of the sites sampled. The average score for all sites in the investigation was 22 points.
12. Conclusions and further investigation 12.1. Water quality of watercourses and individual sites The River Lee and the majority of the six tributaries within this investigation have severe problems with water quality. It is imperative further efforts be made to improve the water quality within the Stonebridge Brook. Additional efforts should also be made to improve water quality within the London River Lee, Moselle Brook, Salmons Brook and Pymmes Brook. Further intensive investigations could be used to determine the source of water quality problems within these watercourses. Water quality is lowest within sites 1 to 3 on the Salmons Brook. In addition to this the confluence of the Pymmes Brook with the River Lee appears to have severe water quality issues. 12.2. Levels of parameters within the investigation All of the watercourses had high levels of chemical oxygen demand with alarmingly high counts of total coliforms, in addition to some localised problems with faecal coliforms. The excessive level of microbial activity within most of samples is a sign that a considerable amount of dissolved oxygen in the water column is being used in aerobic processes to breakdown organic matter and maybe organic pollutants. Biochemical oxygen demand levels would indicate that microbial use of dissolved oxygen is only occurring within a small fraction of sampled sites. The possible presence of a number of inorganic pollutants within the investigated watercourses cannot be ruled out, as they could be utilising dissolved oxygen in the water column in reduction-oxidation (redox) processes. Although coliforms do not cause disease themselves, they can be used to assess the possible risk to human and pet health if individuals were to come into contact with water from these watercourses. Possible sources of faecal coliforms include seepage of faecal waste from domestic pets, untreated or poorly treated sewage effluent, in addition to seepage of agricultural silage or livestock waste. This therefore could indicate possible problems with pet waste disposal, sewage treatment processes, pipe misconnections from domestic and commercial foul sewers or poor waste management practices within local farms. High levels of total coliforms may indicate inadequate poor processing of sewage effluent and in particular sanitary sewage in addition to misconnections from domestic and commercial properties. Sites 1 and 2 on the Moselle Brook, site 7 on the Pymmes Brook and sites 1 and 2 on Salmons Brook were conspicuously high in both nitrate and reactive phosphate concentrations. This is a possible indicator of problems with nutrient seepage into the waterway. Turbidity was found to be excessively high within the Dagenham Brook, Moselle Brook and the River Lee. Although the turbid nature of the water may not be a problem in itself, it could be a possible indication of automobile and road-associated contaminants leeching into the waterways. | |||||||||||||||||||||||||||||||||||||||||||||||||||||||||||||||||||||||||||||||||||||||||||||||||||||||||||||||||||||||||||||||||||||||||||||||||||||||||||||||||||||||||||||||||||||||||||||||||||||||||